Powerful, Intuitive Water Planning
WEAP provides a flexible, GIS-based platform for integrated water resources planning. Design, simulate, and visualize your system with ease.
Overview
An intuitive GIS-based graphical interface provides a simple, yet powerful, means for constructing, viewing, and modifying the configuration. The user designs a schematic of the system using the mouse to "drag and drop" elements to be added to the system. These elements can be overlain on a map built from ArcGIS and other standard GIS and graphic files. Data for any component can be edited directly by clicking on the desired symbol in the schematic.
The user may consult the context-sensitive help feature from anywhere in WEAP. Wizards, prompts, and error messages provide advice throughout the program. With its highly flexible and comprehensive reporting system, the user may customize reports as graphical, tabular or map-based output and select from a number of formatting options (e.g., metric or English units, years, absolute levels, percent shares, or growth rates). Specific report configurations can be saved as "favorites," which can be combined into "overviews," or summaries, of key system indicators; these overviews can then be retrieved quickly for review.
WEAP is available in the following languages (some not fully translated): English, Arabic, Chinese, Farsi, French, Greek, Korean, Portuguese, Russian, Spanish and Thai. An option on the WEAP menu allows the user to switch between these languages. Please contact us if you want to join other volunteers to help translate WEAP into these and other languages.
Integrated Planning
Seamlessly combine water demand, supply, allocation, and quality in one unified modeling framework.
Built-in Hydrology Models
Simulate rainfall runoff, infiltration, evapotranspiration, crop requirements and yields, and surface water/groundwater interaction.
GIS-Driven Schematic
Drag and drop elements onto a customizable GIS map using ArcGIS and other standard graphic or GIS layers.
Custom Variables & Equations
Define your own assumptions and functions to capture system-specific dynamics and add user-defined variables and equations.
Excel and Model Integration
Link dynamically to spreadsheets and other models for flexible data flows and connections.
Built-in Optimization
WEAP includes an embedded linear program that solves allocation equations.
Flexible Data Structures
Utilize flexible and expandable data structures to model your system at any level of detail.
Powerful Reporting
Generate custom graphs, tables, and maps using a highly flexible and comprehensive reporting system with formatting options such as metric/English units, percent shares, or growth rates.
Help & Wizards
Context-sensitive help, built-in wizards, prompts, and error messages provide real-time guidance throughout the program.
Minimal Requirements
Runs under Windows XP, Vista, 7, 8, or 10 with just 256 MB RAM.
How WEAP is Structured
WEAP consists of five main views
Schematic
Use drag-and-drop GIS tools to build, organize, and layer your water system.
Data
Input assumptions, build formulas, and dynamically link to Excel for easy data handling.
Results
View outputs across time in animated graphs, tables, and geographic overlays.
Scenario Explorer
Compare key indicators across multiple policy or climate scenarios.
Notes
Document your assumptions and track data sources for transparency.
Demonstration
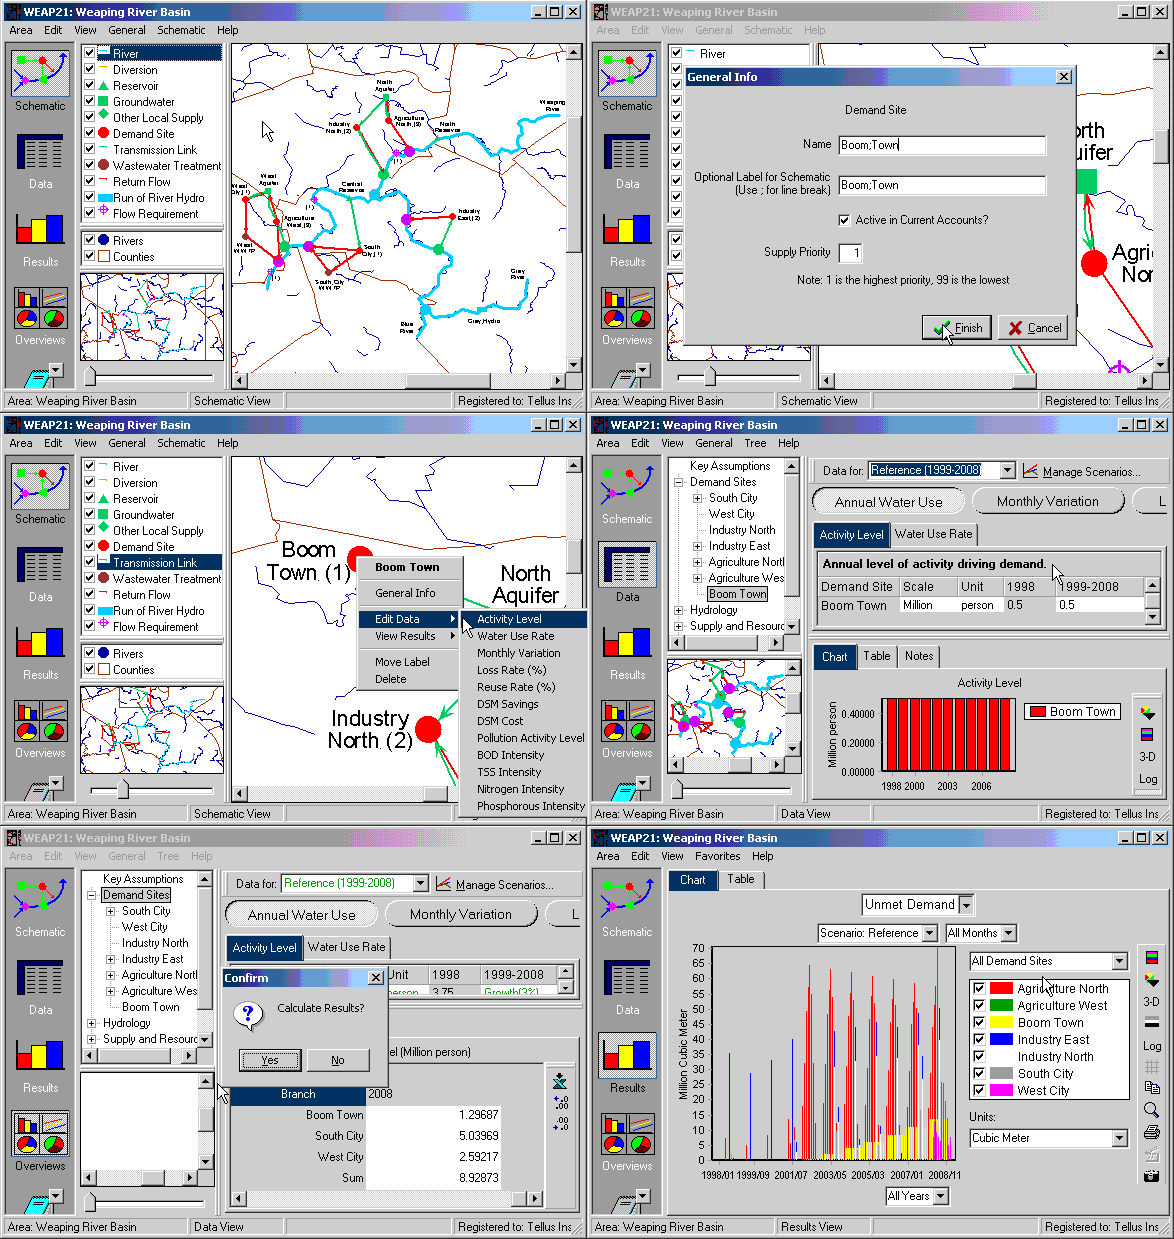
Watch the animated image below to see a brief simulation of WEAP.
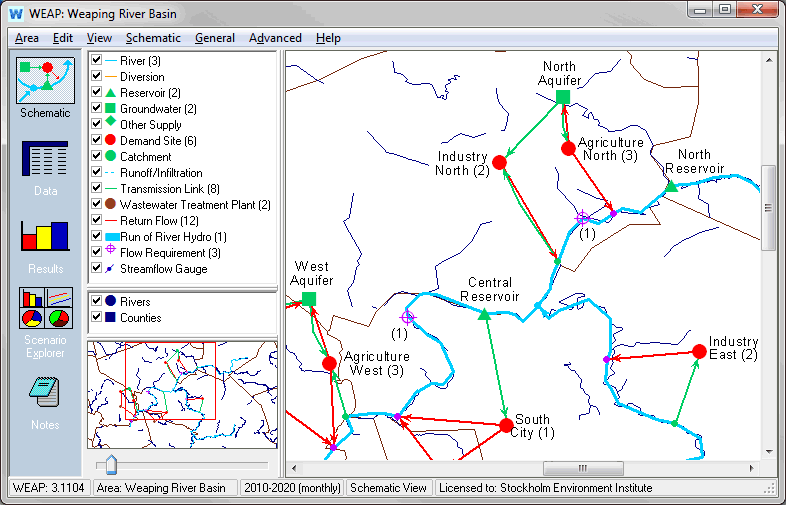
Schematic
GIS tools for configuring your system.
Drag and drop to create and position.
Add ArcGIS or other standard GIS vector or raster files as background layers.
Instant access to data and results for any node.
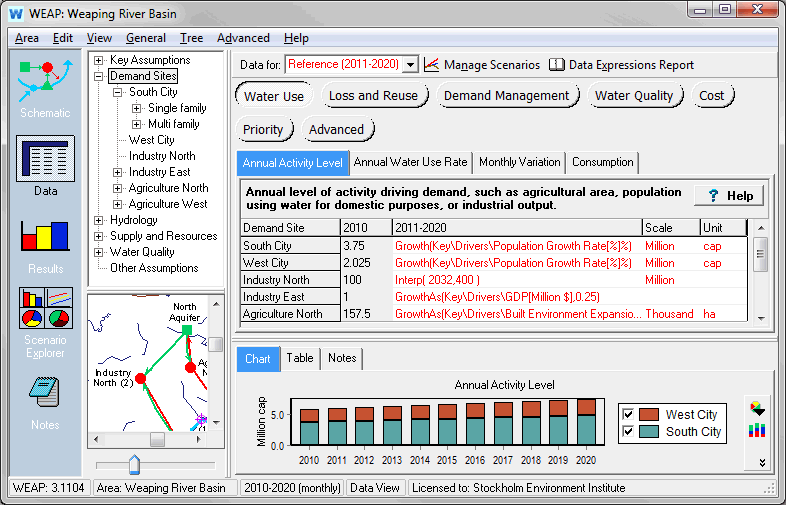
Data
Model building: create variables and relationships, enter assumptions and projections using mathematical expressions, dynamically link to Excel.
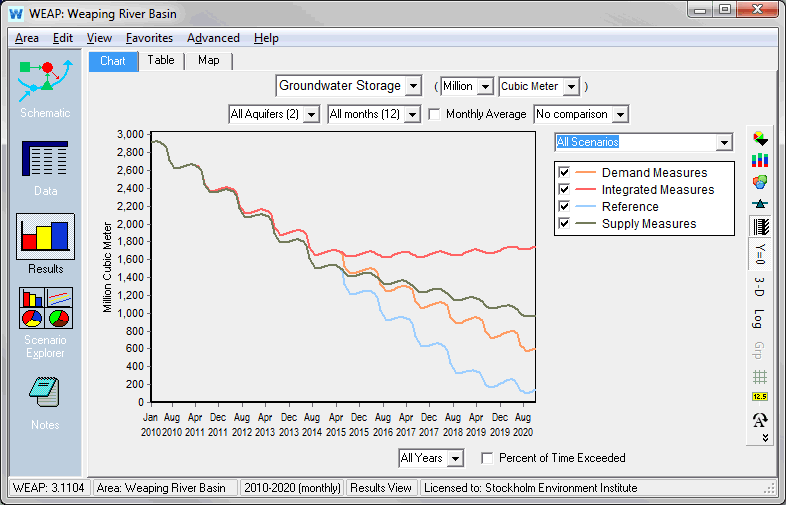
Results - Data
Detailed and flexible display of all model outputs, in charts and tables and on the Schematic.
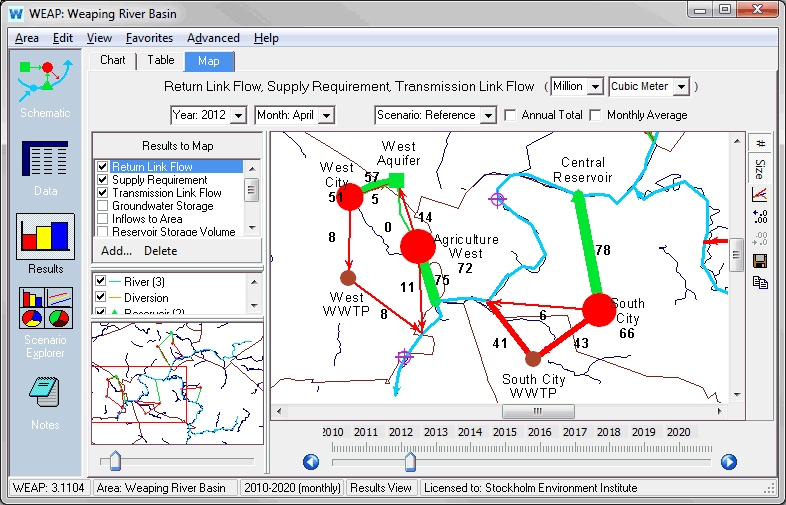
Results - Map
Display results on the map
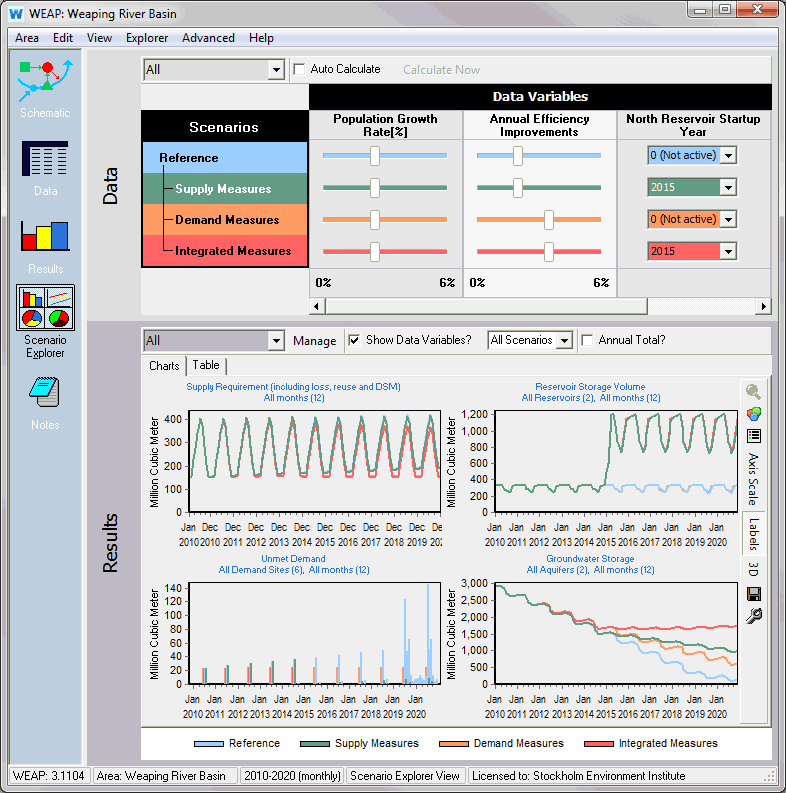
Scenario Explorer
Highlight key assumptions and indicators in your system and explore how changes in one can affect the other.
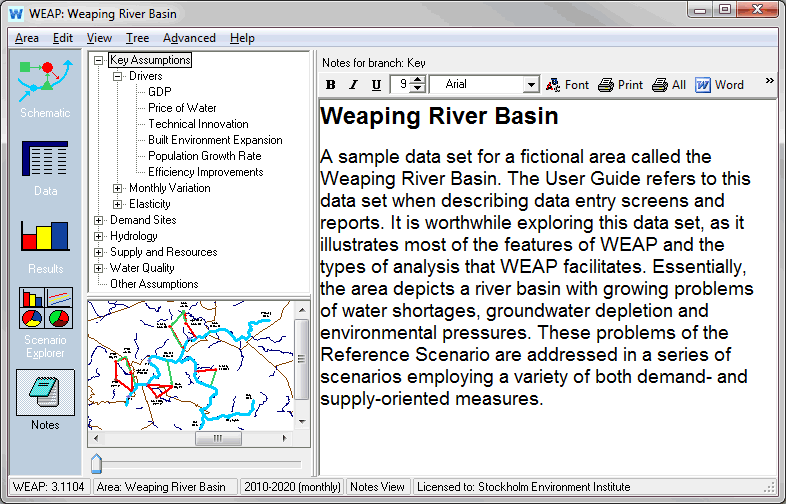
Notes
Document your data and assumptions.