These wizards help you explore, preprocess, visualize and import time series data from delimited text files by constructing ReadFromFile and FDCShift expressions. (Refer to the help topic on ReadFromFile for a detailed explanation of its various options, which will only be briefly mentioned here.) The FDCShift Wizard is almost identical to the ReadFromFile Wizard, except for a few additions that will be described at the end.
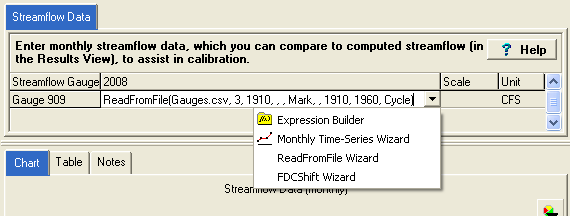
To access the wizard, click the down arrow on the right of the expression box to drop down the list of choices. Choose ReadFromFile Wizard or FDCShift Wizard. If there is already a ReadFromFile or FDCShift function in the expression, just double click the expression to open it in the appropriate wizard. Note: Although the FDCShift Wizard is only listed when editing Minimum Flow Requirements or Gauge Streamflow Data, you can type in the FDCShift function directly, and then double click it to load the wizard.

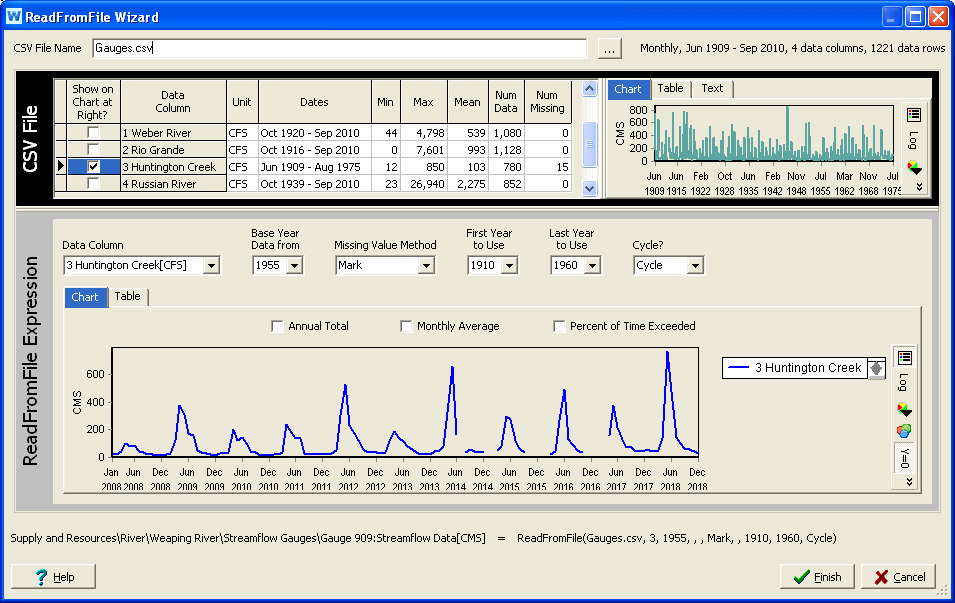
When you go into the wizard, it will first ask you to select the CSV file to read. If the CSV file is properly formatted in the ReadFromFile format, WEAP will read it and display summary statistics about the file at the top, to the right of the filename: timestep, year range and number of data columns and rows.
The top half of the wizard (in the black bordered box labeled CSV File) displays all information from the file. On the left there is a grid showing the list of data columns and statistics for each. (Tip: The column name and unit come from the $Columns= line at the top of the CSV file -- including this line helps document the information it contains.) Check the box Show on Chart at Right? to display data from that column on the chart and table shown on the right side of the top half. All data in the checked columns will be shown, for all years and in the original timesteps of the file, regardless of the WEAP area timestep and time horizon. As with all charts in WEAP, you can zoom and pan the chart -- hold down the control key and click and drag down and to the right to select an area to zoom into, hold down the shift key and click and drag to pan the chart right or left.
The bottom half of the wizard (in the silver bordered box labeled ReadFromFile Expression or FDCShift Expression) displays only processed information from the data column selected by the Data Column dropdown box, in the timestep and time horizon for the current area. (When you change the selected column here in the bottom half, it will be automatically be graphed in the top half.) Any changes to the ReadFromFile options (Base Year Data from, Aggregation or Disaggregation Method, Missing Value Method, First Year to Use and Last Year to Use, Cycle?) will instantly be reflected in the chart or table below. (The Missing Value Method choice is only shown if the selected data column has any missing values -- see the Num Missing column in the information grid at the top. In the example below, the selected column has 15 missing values, which appear as gaps in the chart because the Missing Value Method is "Mark.") The vertical toolbar to the right of the charts can be used to change the formatting of the charts. For the lower chart, you can display all timesteps in the time horizon, or Annual Totals, or Monthly Averages. Click Percent of Time Exceeded to sort the values from highest to lowest. For flows, this type of graph is called a "Flow Duration Curve."
At the bottom of the wizard, the expression being constructed is shown. When you click the Finish button, this expression will be pasted into the expression box.

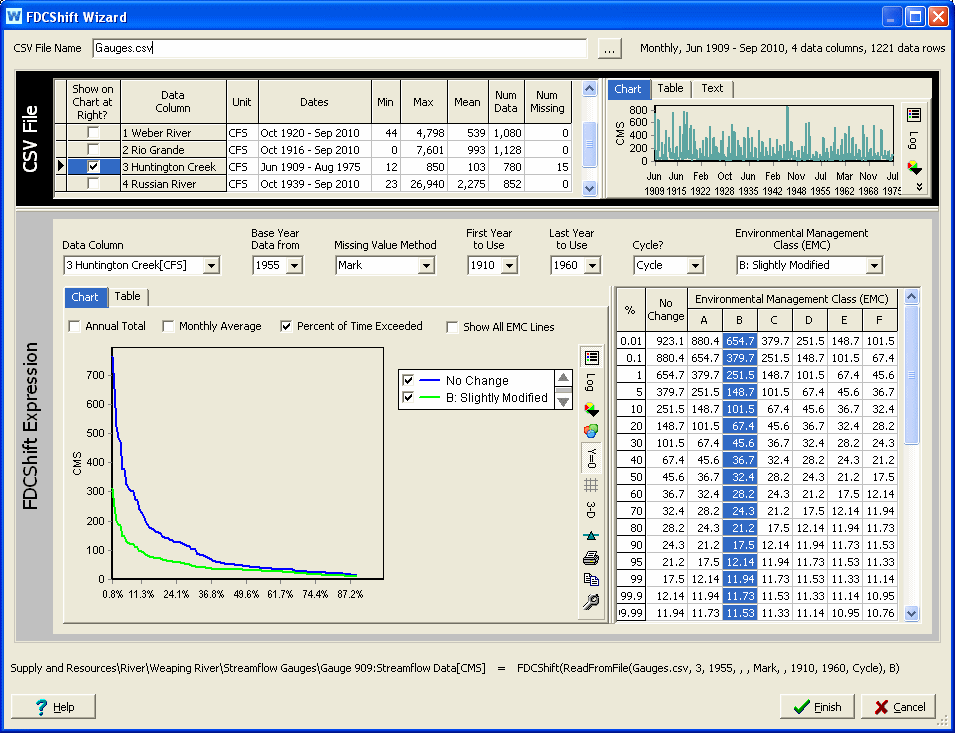
The FDCShift function is used to estimate the recommended streamflow in a modified stream, by uniformly reducing (shifting) the natural (unregulated) flow duration curve by a fixed number of percentile places, and further disaggregating it into a complete time series of modified flows. This estimated time series represents the environmental flow requirement (in order to maintain the stream in a given ecological condition (environmental management class) ), and would typically be used to set the requirement for a flow requirement object. As an alternative to setting a flow requirement, you could add a streamflow gauge object to the river and set its flow using FDCShift. In this way, you could compare the streamflow simulated by WEAP to the FDCShifted flow representing an Environmental Management Class.
The number of steps to reduce (shift) is given by the Environmental Management Class (EMC) parameter (A-F, corresponding to a shift of 1-6 steps). A shift of one step corresponds to moving from one number to the next larger number in the following list of percentiles on the flow duration curve (FDC): 0.01%, 0.1%, 1%, 5%, 10%, 20%, 30%, 40%, 50%, 60%, 70%, 80%, 90%, 95%, 99%, 99.9% and 99.99%. For example, a shift of 2 places (B: Slightly Modified) would mean that a 60% flow would be reduced to a 80% flow, and a 90% flow would be reduced to a 99% flow. For percentiles between the specified values, e.g., 85%, WEAP will do a linear interpolation.
The FDCShift Wizard shows both the original (No Change) and the shifted flows on the chart. Select Show All EMC Lines to see all 6 environmental management class lines on the chart. The table to the right of the chart lists the flows at each of the 17 percentiles for No Change and the 6 environmental management classes; the selected EMC is highlighted.

See also: ReadFromFile, FDCShift