This screen is used in conjunction with the Plant Growth Model Method for catchment hydrology and crop water requirements.
WEAP comes with a built-in library of crop data for over 100 crops. These data are used to estimate crop growth, evapotranspiration, irrigation requirements, and yields. You can edit this library or add to it. An excellent source of additional crop data can be found in the documentation for the SWAT (http://swat.tamu.edu/documentation/) model. Buttons on the toolbar at the top allow you to add, delete or rename crops. The Copy button will create a new crop as a copy of the highlighted crop. You can export one or more crops to a comma separated value (CSV) file, which can be edited in Excel or a text editor. All the crops currently shown on screen will be exported. You can import crops from a CSV file--new crops can be added in this way, or data for existing crops can be updated. When reading in from the file, WEAP will match both the crop name and typical planting month. This is because there can be multiple entries for the same crop, but with different planting dates. The format for the CSV file to import must be the same format as is created when exporting--the same columns of data in the same order. Each WEAP area (dataset) has its own copy of the Crop Library. Therefore, changes made to the library in one area will not affect the library of another area. You can use import and export to move values from one area's library to another.
By default, the Crop Library screen will at first show you only the crops that are currently in use in your area (those that have been assigned to catchment branches in the Data View, under Land Use). To see all crops in the library, change the selection in the upper left from "Show Only Crops in Use" to "Show Entire Crop Library." You can also search for a crop by entering all or part of its name or the name of its category, in the search box on the upper right of the toolbar. For example, type Fruit into the search box. You can view multiple crops at once (List View) or one at a time (Single View).
The following columns of information exist for each crop:
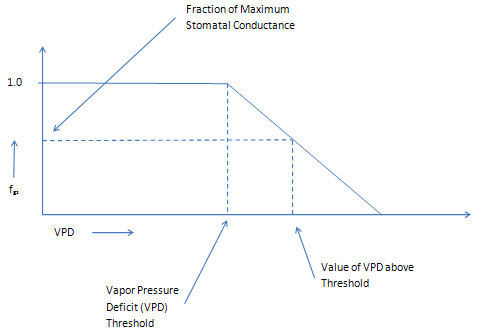
VPD threshold above which the stomatal conductance is reduced. Values are in kPa. For reference see figure and description below.
Stomatal conductance is calculated as the product of Maximum Stomatal Conductance and the function fgs. The function fgs is one for values of VPD less than the “Vapor Pressure Deficit (VPD) Threshold.” For values of VPD greater than the threshold, fgs decreases linearly passing through the point defined by the “Value of VPD above Threshold” and the “Fraction of Maximum Stomatal Conductance.”
Value of VPD used to define the linear relationship that describes the decrease in stomatal conductance as VPD increases. Values are in kPa. For reference see figure and description above.
Fraction of maximum stomatal conductance that is used to define the linear relationship that describes the decrease in stomatal conductance as VPD increases. Values can range from 0.0 to 1.0. For reference see figure and description above.
The maximum amount of precipitation that can be intercepted by the simulated vegetation’s canopy. Water that is intercepted is evaporated as a function of the evaporative demand of the atmosphere.
The value of heat unit index (HUI) that is used to define point # 1 through which the LAI curve passes. See figure below. Note: WEAP uses fixed LAI for non-deciduous, perennial crops based on the assumption that these crops, like pine trees and orange trees, do not lose their leaves all year long. If you want to have a crop with a developing canopy, you can create a new crop/land cover and classify it as an annual or deciduous.
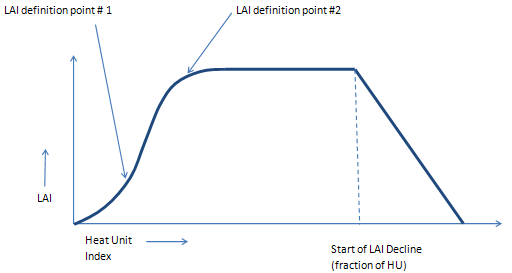
The value of leaf area index (LAI) that is used to define point #1 through which the LAI curve passes. See figure above.
The value of heat unit index (HUI) that is used to define point # 2 through which the LAI curve passes. See figure above.
The value of leaf area index (LAI) that is used to define point #2 through which the LAI curve passes. See figure above.
The air temperature below which no growth occurs. See figure below.
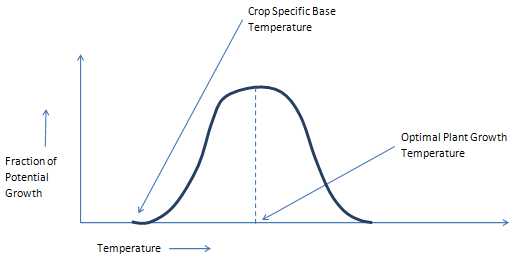
The air temperature at which plant growth is optimal. See figure above.
Number of heat units, assuming a base temperature of zero, that must be accumulated before planting can occur. Heat units begin accumulating on the date specified in General – Basic Parameters – “Date to reset heat unit accumulation every year.”
Number of heat units, using a crop specific base temperature, that are required to accumulate after planting to reach plant maturity.
The value of the heat unit index at which the leaf area index (LAI) begins to decline. See figure below.
The slope of the curve that describes the relationship between vapor pressure deficit (VPD) and the radiation use efficiency (RUE). See figure below.

The function illustrated above reduces the maximum radiation use efficiency as a function of the VPD. The RUE remains at the maximum value, which is calculated as a function of the atmospheric carbon dioxide concentration, until the Vapor Pressure Deficit Threshold is exceeded. The RUE is then reduced at the rate specified by the Slope of the RUE-VPD Curve parameter until a minimum of 0.27 x the maximum RUE is reached.
Note: the Vapor Pressure Deficit Threshold is the same threshold value used in the stomatal conductance reduction function. This is typically a value of around 1.0 kPa (Neitsch, et al, 2004)
This parameter is used in the calculation of the daily solar radiation intercepted by the leaf area of the plant. This parameter typically has a value close to 0.65. This parameter is used in the following equation to calculate the photosynthetically active radiation (PAR):

Where:
PAR: [Eq. 5:2.1.1 in SWAT 2005]
RA: solar radiation in MJ m-2 d-1
LAI: leaf area index (dimensionless)
ExtCoef: light extinction coefficient, typically this value is close to 0.65.
Constant 0.5: used to convert solar radiation to photosynthetically active radiation (Monteith, 1973)
These parameters are used in partitioning biomass between roots and shoots. They are used in the following equation.
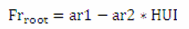
Where:
Frroot: Fraction of total biomass partitioned to roots on a given day in the growing season, [Eq. 5:2.1.21 in SWAT 2005]
ar1: biomass partitioning parameter 1, typically this value is 0.4.
ar2: biomass partitioning parameter 2, typically this value is 0.2.
HUI: Heat Unit Index, the fraction of potential heat units accumulated for the plant on a given day in the growing seas
The crop height at maturity.
Root depth at maturity.
Atmospheric carbon dioxide concentration that is used in calculating the effect of elevated CO2 concentration on leaf area index, stomatal conductance, and radiation use efficiency.
Atmospheric carbon dioxide concentration that is used in calculating the effect of elevated CO2 concentration on leaf area index, stomatal conductance, and radiation use efficiency.
Leaf area index at the lower CO2 level. This parameter is used in the calculations for the maximum potential LAI. See the graph below for an illustration of the linear function.
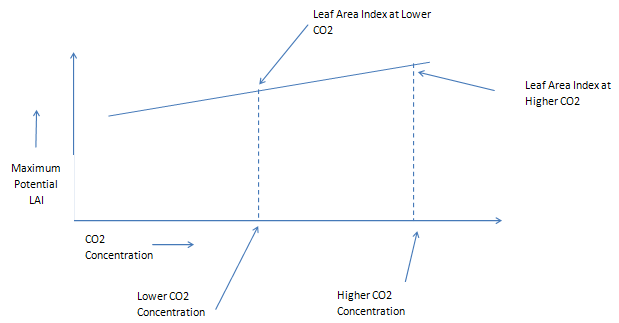
Leaf area index at the higher CO2 level. This parameter is used in the calculations for the maximum potential LAI. See the graph above for an illustration of the linear function.
Stomatal conductance at the lower CO2 level. This parameter is used in the calculations for the maximum potential stomatal conductance. Additional calculations can reduce the stomatal conductance as a function of vapor pressure deficit. See the graph below for an illustration of the linear function.
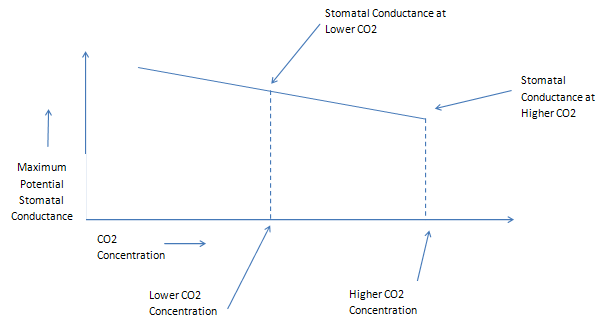
Stomatal conductance at the higher CO2 level. This parameter is used in the calculations for the maximum potential stomatal conductance. Additional calculations can reduce the stomatal conductance as a function of vapor pressure deficit. See the graph above for an illustration of the linear function.
Radiation use efficiency at the lower CO2 level. This parameter is used in the calculations for the maximum potential radiation use efficiency (RUE). See the graph below for an illustration of the non-linear function that describes the change in RUE as a function of CO2 concentration. Additional calculations can reduce the radiation use efficiency as a function of vapor pressure deficit.
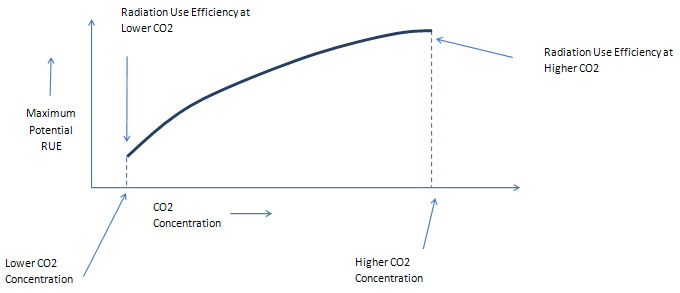
Radiation use efficiency at the higher CO2 level. This parameter is used in the calculations for the maximum potential radiation use efficiency (RUE). See the graph above for an illustration of the non-linear function that describes the change in RUE as a function of CO2 concentration. Additional calculations can reduce the radiation use efficiency as a function of vapor pressure deficit.
Research at FACE experiment sites has shown that canopy temperature increases as a function of elevated atmospheric CO2 levels (Kimball, 2010). In order to simulate this effect, set this parameter to the amount of canopy temperature increase caused by the increase from the lower to the higher level of CO2. This temperature change will be added to the maximum and minimum temperature values for the day prior to their use in calculating evapotranspiration. To ignore this effect, set this value to 0.0.
The harvest index is the portion of the above ground biomass of the plant that will be removed during harvest. The potential harvest index is the harvest index for optimal growing conditions. This value is between 0 and 1 for plants where the harvestable portion is aboveground. For plants in which the harvestable portion is below ground (e.g. potatoes), the harvest index can be greater than 1.
This is the minimum possible value of the harvest index. This would occur when the plant experiences sever water stress.
This is the portion of the harvestable biomass that is not lost during the harvest operation. Values range between 0 and 1.
This is the fraction of the plant residue that will decompose within a day given optimal conditions. It is suggested that this value be set to 0.05.
This is the management allowable depletion (MAD) value that will be used for the crop unless otherwise specified in the Irrigation Scheduling Wizard. The MAD is expressed as the fraction of the soil moisture content between field capacity and permanent wilting point that is available for extraction by the plant. This value ranges between 0 and 1. The water contents at field capacity and wilting point are specified in the Soil Library.
This is the value of leaf area index (LAI) at the beginning of the growing season or immediately after a cutting for hay or lawn crops.
This is the value of the plant biomass (mass/area) at the beginning of the growing season or immediately after a cutting for hay or lawn crops.
This is the typical number of cuttings that occur for a hay or lawn crop in a season. This value is used to automatically parameterize the Crop Scheduling Wizard. The actual number of cuttings can be altered by the user in the Crop Scheduling Wizard. This parameter is useful for crops that typically receive a fixed number of cuttings each year (e.g. alfalfa).
This is the typical number of days between cuttings that occur for a hay or lawn crop during the season. This value is used to automatically parameterize the Crop Scheduling Wizard. The actual number of days between cuttings can be altered by the user in the Crop Scheduling Wizard. This parameter is useful for crops such as lawns that receive cuttings on a regular, periodic schedule.
This parameter is used to determine when to cease irrigation for deciduous crops. In order to account for lengthening growth seasons that occur with climate warming, the algorithm that controls irrigation of deciduous crops is temperature dependent. If the “Earliest Cessation of Irrigation” date has passed and three days with an average temperature less than the “3-Day Avg Min Temp for Irrigation Cessation” occur, then irrigation is stopped for the season.
This parameter is used to determine when to cease irrigation for deciduous crops. In order to account for lengthening growth seasons that occur with climate warming, the algorithm that controls irrigation of deciduous crops is temperature dependent. If the “Earliest Cessation of Irrigation” date has passed and three days with an average temperature less than the “3-Day Avg Min Temp for Irrigation Cessation” occur, then irrigation is stopped for the season.
This parameter is used to determine when to cease deciduous crop evapotranspiration. The algorithm that controls the cessation of deciduous crop transpiration is temperature dependent so that the model can account for the lengthening of growing seasons that will occur with climate warming. Leaf fall, and the cessation of crop transpiration, occurs when the “Earliest Onset of Leaf Fall” has passed and three days with an average temperature less than the “3-Day Avg Min Temp for Onset of Leaf Fall” have occurred.
This parameter is used to determine when to cease deciduous crop evapotranspiration. The algorithm that controls the cessation of deciduous crop transpiration is temperature dependent so that the model can account for the lengthening of growing seasons that will occur with climate warming. Leaf fall, and the cessation of crop transpiration, occurs when the “Earliest Onset of Leaf Fall” has passed and three days with an average temperature less than the “3-Day Avg Min Temp for Onset of Leaf Fall” have occurred.
The daily rate of water flow through in the rice field. This rate is in addition to the amount of water required to maintain the ponded depth when calculating the irrigation requirement. This water is typically applied in order to control temperature and water quality in the rice field.
The figure below is provided as a reference in specifying the remaining rice related parameters.
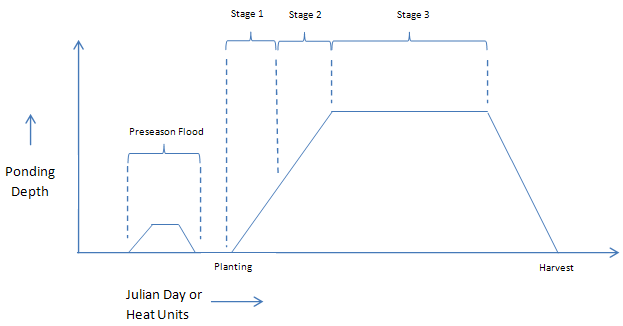
Number of heat units that need to accumulate before the rice preseason flood will begin. The accumulated heat units are calculated assuming a base temperature of zero and a start date as specified in General – Basic Parameters – “Date to reset heat unit accumulation every year.”
Note: this is only used if “Use Heat Units” is specified in the “Planting Date” of the Crop Scheduling Wizard.
Number of heat units that need to accumulate before the rice preseason flood will end. The accumulated heat units are calculated assuming a base temperature of zero and a start date as specified in in General – Basic Parameters – “Date to reset heat unit accumulation every year.”
Note: this is only used if “Use Heat Units” is specified in the “Planting Date” of the Crop Scheduling Wizard.
The Julian day on which the preseason flood of a rice field will begin.
Note: this is only used if a date is specified in the “Planting Date” of the Crop Scheduling Wizard.
The Julian day on which the preseason flood of a rice field will end.
Note: this is only used if a date is specified in the “Planting Date” of the Crop Scheduling Wizard.
This parameter specifies the end of rice flood stage I as a fraction of the total heat units required to reach plant maturity. Flood stage I begins with planting and ends at the point specified by this parameter. During Rice Flood Stage I the flood depth will increase linearly from “The Max Ponding Depth at Planting” to “The Max Ponding Depth during Stage I.” The value is between 0 and 1.
This parameter specifies the end of rice flood stage II as a fraction of the total heat units required to reach plant maturity. Flood stage II begins at the end of flood stage I and ends at the point specified by this parameter. During Rice Flood Stage II the flood depth will increase linearly from “The Max Ponding Depth during Stage I” to “The Max Ponding Depth during Stage II.” The value is between 0 and 1.
This parameter specifies the end of rice flood stage III as a fraction of the total heat units required to reach plant maturity. Flood stage III begins at the end of flood stage II and ends at the point specified by this parameter. During Rice Flood Stage III the flood depth will increase linearly from “The Max Ponding Depth during Stage II” to “The Max Ponding Depth during Stage III.” The value is between 0 and 1.
Depth of ponding in the rice field prior to the preseason flood. This parameter can be used if off season ponding is required for management purposes. If no ponding is required set this value to zero.
This is the depth of ponding on the rice field during the preseason flood period. The starting and ending of this period is the specified with the “Start of Preseason Flood” and “End of Preseason Flood” parameters. If there is no preseason flood, set this value to zero.
This is the depth of ponding between the “End of Preseason Flood” and the planting of the rice crop. Often, this value is zero.
This is the maximum depth of ponding that will occur during the early part of the rice crop development. Ponding will change linearly from the “Max Ponding Depth at Planting” to this value during the period from the planting date through the “End of Flood Stage I.”
Ponding will change linearly from the “Max Ponding Depth During Stage I” to this value during the period between the “End of Flood Stage I” and the “End of Flood Stage II.”
Ponding will change linearly from the “Max Ponding Depth During Stage II” to this value during the period between the “End of Flood Stage II” and the “End of Flood Stage III.”
Ponding will change linearly from the “Max Ponding Depth During Stage III” to this value during the period between the “End of Flood Stage III” and the crop harvest.
Ponding will be maintained at this depth following the harvest of the rice crop. Typically this is done for management purposes such as straw decomposition or wildlife management. This depth will be maintained until the calculation of heat unit accumulation is restarted the following year. This occurrence is specified by the parameter in General – Basic Parameters – “Date to reset heat unit accumulation every year.” To have no ponding in the post-season, set this value to zero.
See also: Plant Growth Model Calculation Algorithms
Menu Option: General: Crop Library (only available if there is at least one catchment on the schematic whose method is "Plant Growth Method.")