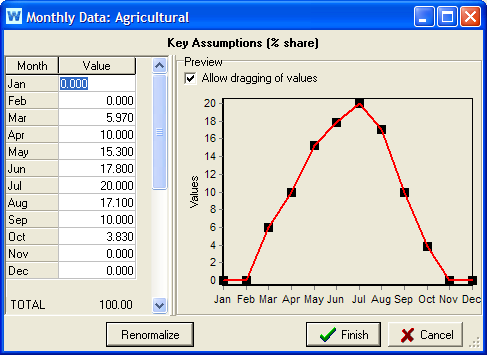
The Monthly Time-Series Wizard helps you enter values that vary monthly but not yearly, e.g., monthly variation of demand. Enter monthly values in the table on the left and they will be graphed on the right. If you leave some months blank, WEAP will interpolate using adjacent points. For data variables that should sum to 100%, e.g., Monthly Variation of Demand, you can cilck the Renormalize button to scale all values so that they sum to 100%.
NB: You can paste an array of values, such as from Excel (either as a single row or a single column), and WEAP will fill the Value column in the table with those values, starting on the month where the cursor is. Also, you can paste an array of values directly into the expression box on the Data View, instead of first coming to the Monthly Time-Series Wizard.
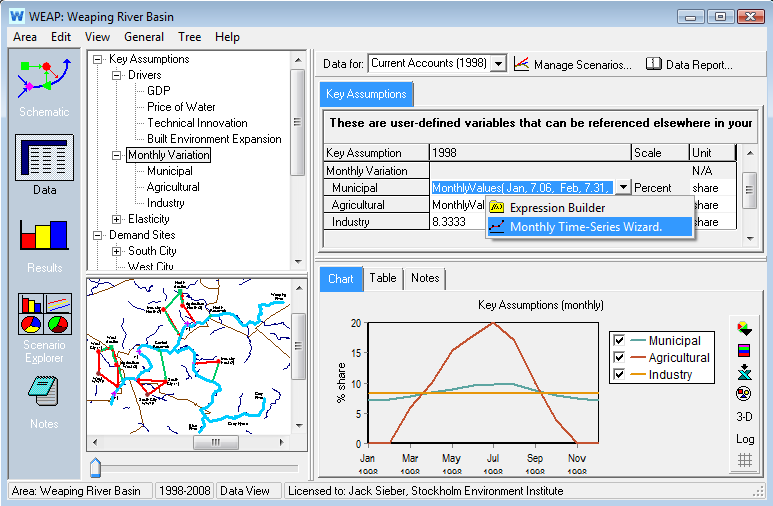
After clicking the Finish button to close the wizard, WEAP will construct a MonthlyValues function to represent the monthly values you entered, e.g., MonthlyValues(Jan, 5, Feb, 5, Mar, 10, ...)
To access the wizard, either right-click on the data table or click on the down arrow on the right side of the expression box, and choose Monthly Time-Series Wizard from the menu.