On the Map Layer window, you can choose map colors, data, styles and labels for display, and view or edit associated attribute data for your vector GIS layers (in ESRI Shape file format: *.shp).
Note: You can link shapes in a polygon shapefile to schematic objects and demand branches so that results associated with those objects or branches can be displayed as "thematic" maps. See the "Thematic Maps" section of Result Maps for more information, including how to link.
The Map Layer window has four tabs on the left: Map File, Appearance, Label and Linkage. The Map File tab shows the Shape file's name (*.shp), which you can change by typing the new name or clicking the "..." to browse for the file. Unless the shape files are very large or shared among several WEAP areas, it is best to copy the shape files used by an area (including files associated with the Shape file, such as .dbf, .shx and .prj) into that area's subdirectory or a subdirectory within the area's subdirectory, so that they will be included with the area's data files in backups and copies you give to others.
There are three types of vector Shape files: point, line and area (polygon). The type of the current layer is listed below "Shape Type." The number of items ("features") contained in the layer is shown below the type. For example, the country layer (shown below) has 251 countries.
Each Shape file has an associated "attribute" table, which contains information about each feature in the layer. (These data are stored in a file ending in .dbf.) The structure of the attribute table is shown below the File Name. Hover over a feature on the map for a quick display of its data (below the map); click on a feature in the map to see all of its data on the left (the example below shows information for Sudan). The full attribute data table (one row per feature, one column per attribute) is displayed on the lower right side in the Split or Table view. Click the Edit button above the table to be able to edit the attribute values.
On the Appearance tab you can change how the layer appears in the Schematic. The options vary depending on the Shape type (point, line or area):
Point layers: Change the marker (e.g., circle, square, star) used to display each feature, as well as its size and color.
Line layers: Change the line style (e.g., solid, dashed, dotted) used to display each feature, as well as its width and color.
Area layers: Change the polygon's outline width
and color, and whether it is transparent ("clear") or filled.
If filled, you can choose the fill style (e.g., Solid, Vertical lines,
Light Fill). Additionally,
there are several options for choosing the fill color:
Same color for each shape: Every feature will have the chosen color.
Different color for each shape: Every feature in the layer will have a different color from the chosen palette. The number of colors in the palettes is shown in parentheses after the palette name. If there are more features than colors in the palette, the colors will repeat (except for those listed as having 100 colors, which can actually have an unlimited number of gradations, e.g., rainbow or greyscale).
Different color for each unique value in column: Only features with the same value in the selected column from the attribute table will have the same color (from the chosen palette). For example, the Countries attribute table has a column named COLOR_MAP that has values from 1-8 such that no two adjacent countries have the same value. Using this column to color the map would ensure that no two neighboring countries had the same color.
Different color for each group of shapes: The features will be divided into the specified number of groups, grouped by values in the chosen column ("Group By"). In the example below, the color of each country corresponds to its population. This option is only valid for columns with numeric data (e.g., population, but not name). You can optionally choose a lower and/or upper bound of values to display. This example only shows countries with at least 10,000 people (eliminating those with very small populations, or missing data, which have a value of -99,999). There are three options for choosing the range of values for each group:
Equal number of shapes in each group: Ranges are chosen so that each group has the same number of features. For example, if the 251 countries were split into ten groups, the first group would have the 25 countries with the smallest population, the second group would have the next 25 smallest countries, etc.
Equal range of values in each group: The ranges are chosen so that they have equal size (upper value minus lower value).
Equal range of values in each group (log scale): The ranges are chosen so that they have equal size on a log scale (upper value divided by lower value). This is the best choice for attributes that have a very wide range of values, such as population (ranging from 100 to 1 billion).
On the Label tab you can select which column, if any, to use for labeling the features. Click "Abcd123" in the Font box to change the font name, style or color used for the labels. Set Size (%) so that the labels appear at an appropriate size. If you have selected a column but do not see the labels, increase the Size (%) until they are visible. However, for some features, you may not want the labels to be visible until you are zoomed in quite far, for example, in the Cities layer. Experiment to see which size works best. For line features there is an additional option to wrap the labels along the lines.
On the Linkage tab you can link map features to model objects for display as Thematic Maps in the Results View. For more information, see Result Maps. To link objects, check the box for "Link Layer to Schematic Objects and Demand Branches?"
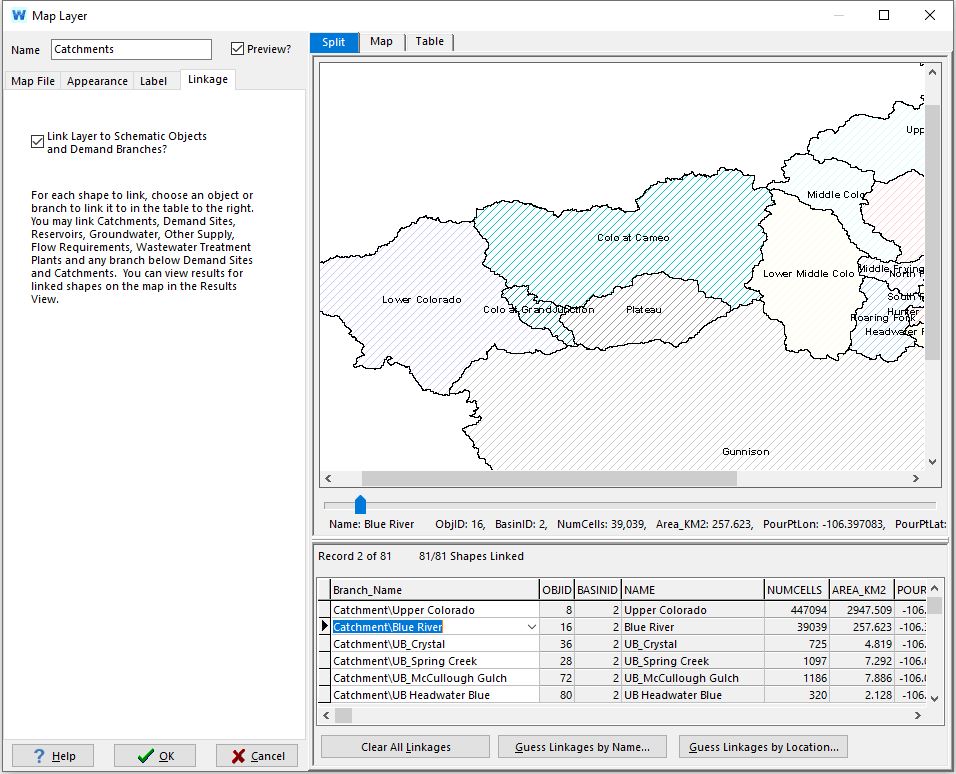
Each shape in the (polygon, not point or line) shapefile can be linked to objects on the Schematic (e.g., Catchments, Demand Sites, Reservoirs, Groundwater Nodes, Wastewater Treatment Plants and Flow Requirements, but not Rivers or Links) or to demand and catchment branches. Each shape is represented by one row in the table. Use the drop-down menu in the "Branch_Name" column of the table to link the shape to an object or branch. When you click on a row, the corresponding shape will briefly flash in the map above to aid you in identification. You may link multiple shapes to the same object or branch. In the example above, the Catchments layer has 81 polygon shapes, each of which is linked to one of the of the 81 catchments on the Schematic. (This layer was created and linked by WEAP's automatic catchment delineation process.)
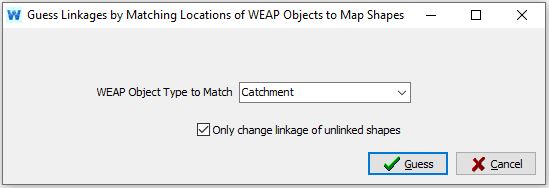
In addition to manually matching shapes to WEAP objects, you can have WEAP guess the linkage by matching their locations or names. When guessing by location, WEAP will link the shape to all the WEAP objects that fall within its boundaries. You can choose to limit the match to only one WEAP object type, such as catchments. And to prevent overwriting any existing linkages with new ones, make sure to check "Only change linkage of unlinked shapes."
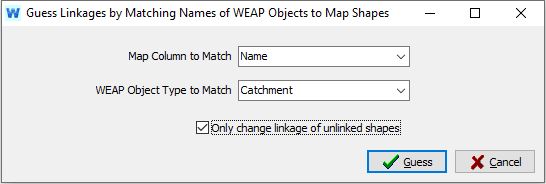
When guessing by name, choose the column in the shapefile's attribute table to use for matching, such as the "Name" column in the example above. You can also choose to limit the match to one WEAP object types; check "Only change linkage of unlinked shapes" to prevent overwriting any existing linkages with new ones.
There is no limit to the number of different background layers that can be linked in this way. For example, you might have one layer for catchments, another for groundwater nodes, and another for cities (demand sites).
Menu Option: Schematic: Add Vector Layer, or, double click on the name of an existing vector layer in the list of background layers on the Schematic.