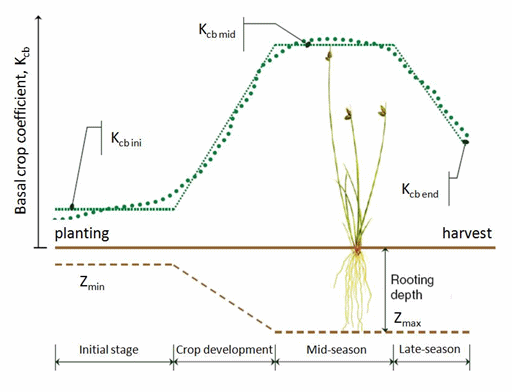
The MABIA Method uses the ‘dual’ Kc method, as described in FAO Irrigation and Drainage Paper No. 56, whereby the Kc value is divided into a ‘basal’ crop coefficient, Kcb, and a separate component, Ke, representing evaporation from the soil surface. The basal crop coefficient represents actual ET conditions when the soil surface is dry but sufficient root zone moisture is present to support full transpiration.
The crop coefficient curve represents the changes in Kcb over the course of the growing season, depending on changes in vegetation cover and physiology. During the initial period, shortly after planting of annuals or prior to the initiation of new leaves for perennials, the value of Kcb is often small.
Definitions for three Kcb values (Kcb ini, Kcb mid and Kcb end) required to construct the curve and associated definitions for growth stage periods and relative ground cover are illustrated below.

The linear Kcb approximation curve is constructed by the following steps:
Divide the growing period into four general growth stages describing crop canopy development and phrenology for a regional specific developmental crop calendar. The four stages are (1) Initial period (planting or green-up until about 10% ground cover); (2) Crop Development period; from 10% ground cover until about 70% ground cover and higher; (3) Mid Season period; from 70% ground cover to the beginning of the late season period (the onset of senescence); and (4) Late Season period (beginning of senescence or mid grain or fruit fill until harvest, crop death, frost-kill, or full senescence).
Specify the three Kcb values corresponding to Kcb ini, Kc mid and Kcb end, where Kcb ini represents the average Kcb during the initial period, Kcb mid represents the average Kcb during the mid-season period and Kcb end represents the Kcb at the end of the late season period.
Connect straight line segments through each of the four growth stage periods, with horizontal lines drawn through Kcb ini during the initial period and through Kcb mid during the mid-season period. Diagonal lines are drawn from Kcb ini to Kcb mid within the domain of the development period and from Kcb mid to Kcb end within the domain of the late season period.
The Kcb coefficient for any period of the growing season can be derived by considering that during the initial and mid-season stages Kcb is constant and equal to the Kcb value of the growth stage under consideration. During the crop development and late season stage, Kcb varies linearly between the Kcb at the end of the previous stage (Kcb prev) and the Kcb at the beginning of the next stage (Kcb next), which in the case of the late season stage is Kcb end:

Where
i = day number within the growing season
[1..length of the growing season],
Kcb i = crop coefficient on day
i,
Lstage = length of the stage
under consideration [days],
S(Lprev) = sum of the
lengths of all previous stages [days].
Values for Kcb i and Lstage come from the Crop Library.
Many crops grown for forage or hay receive multiple harvests during the growing season. Each harvest essentially terminates a “sub” growing season and associated Kcb curve and initiates a new “sub” growing season and associated Kcb curve. The resulting Kcb curve for the entire growing season is the aggregation of a series of Kcb curves associated with each sub cycle.
The Kcb mid and Kcb end values are typical values expected under a standard climatic condition defined in FAO 56 as a sub-humid climate having average daytime minimum relative humidity (RHmin = 45%) and having calm to moderate wind speeds averaging 2 m/s. For specific adjustment in climates where RHmin and u2 are larger or smaller than the standard values, the Kcb mid as well as Kcb end values are adjusted as:

where
Kcb
= the corrected value for Kcb mid
or Kcb end,
Kcb (lib) = value for Kcb mid or Kcb
end taken from Crop Library,
u2 = wind speed measured at 2
m height [m/s],
RHmin = minimum
relative humidity [%],
hmax = maximum plant height [m]
Note: RHmin is used rather than RHmean because it is easier to approximate RHmin from Tmax where relative humidity data are unavailable.
Plant height can be estimated as follows:

where
i = day number within the growing season
[1..length of the growing season],
hi = height of the crop on day
i [m],
Kcb i = crop coefficient on day
i,
Kcb mid = corrected value of
the Kcb mid,
hmax = maximum crop height [m].